Is the Web ready for HTTP/2 Server Push?
On this website, we present our results on the performance impacts of Server Push, e.g., by revisting existing push strategies and guidelines, and derive an alternative approach to push the right resources at the right time, by interleaving the base document and pushed objects.
The source code, documentation and some results can be obtained from this repository.
For more details, we refer to our upcoming paper at ACM CoNEXT 2018.
A pre-print of the paper is available here.
Testbed Overview
Although assessing the performance of Server Push in real-world deployments is crucial for its performance analysis, it imposes practical challenges. Among other factors, websites i) can change due to dynamic third-party content, e.g., ads, or ii) are subject to varying network characteristics. This can cause misinterpretations of the results. Hence, our goal is to understand the isolated performance of Server Push under deterministic conditions, to reduce variability, and to enable reproducibility. Therefore, we use a testbed to replay real-world websites and to grasp the possible potential of Server Push. We exemplify this by using different strategies and revisit existing guidelines, e.g., to assess their overall impact.
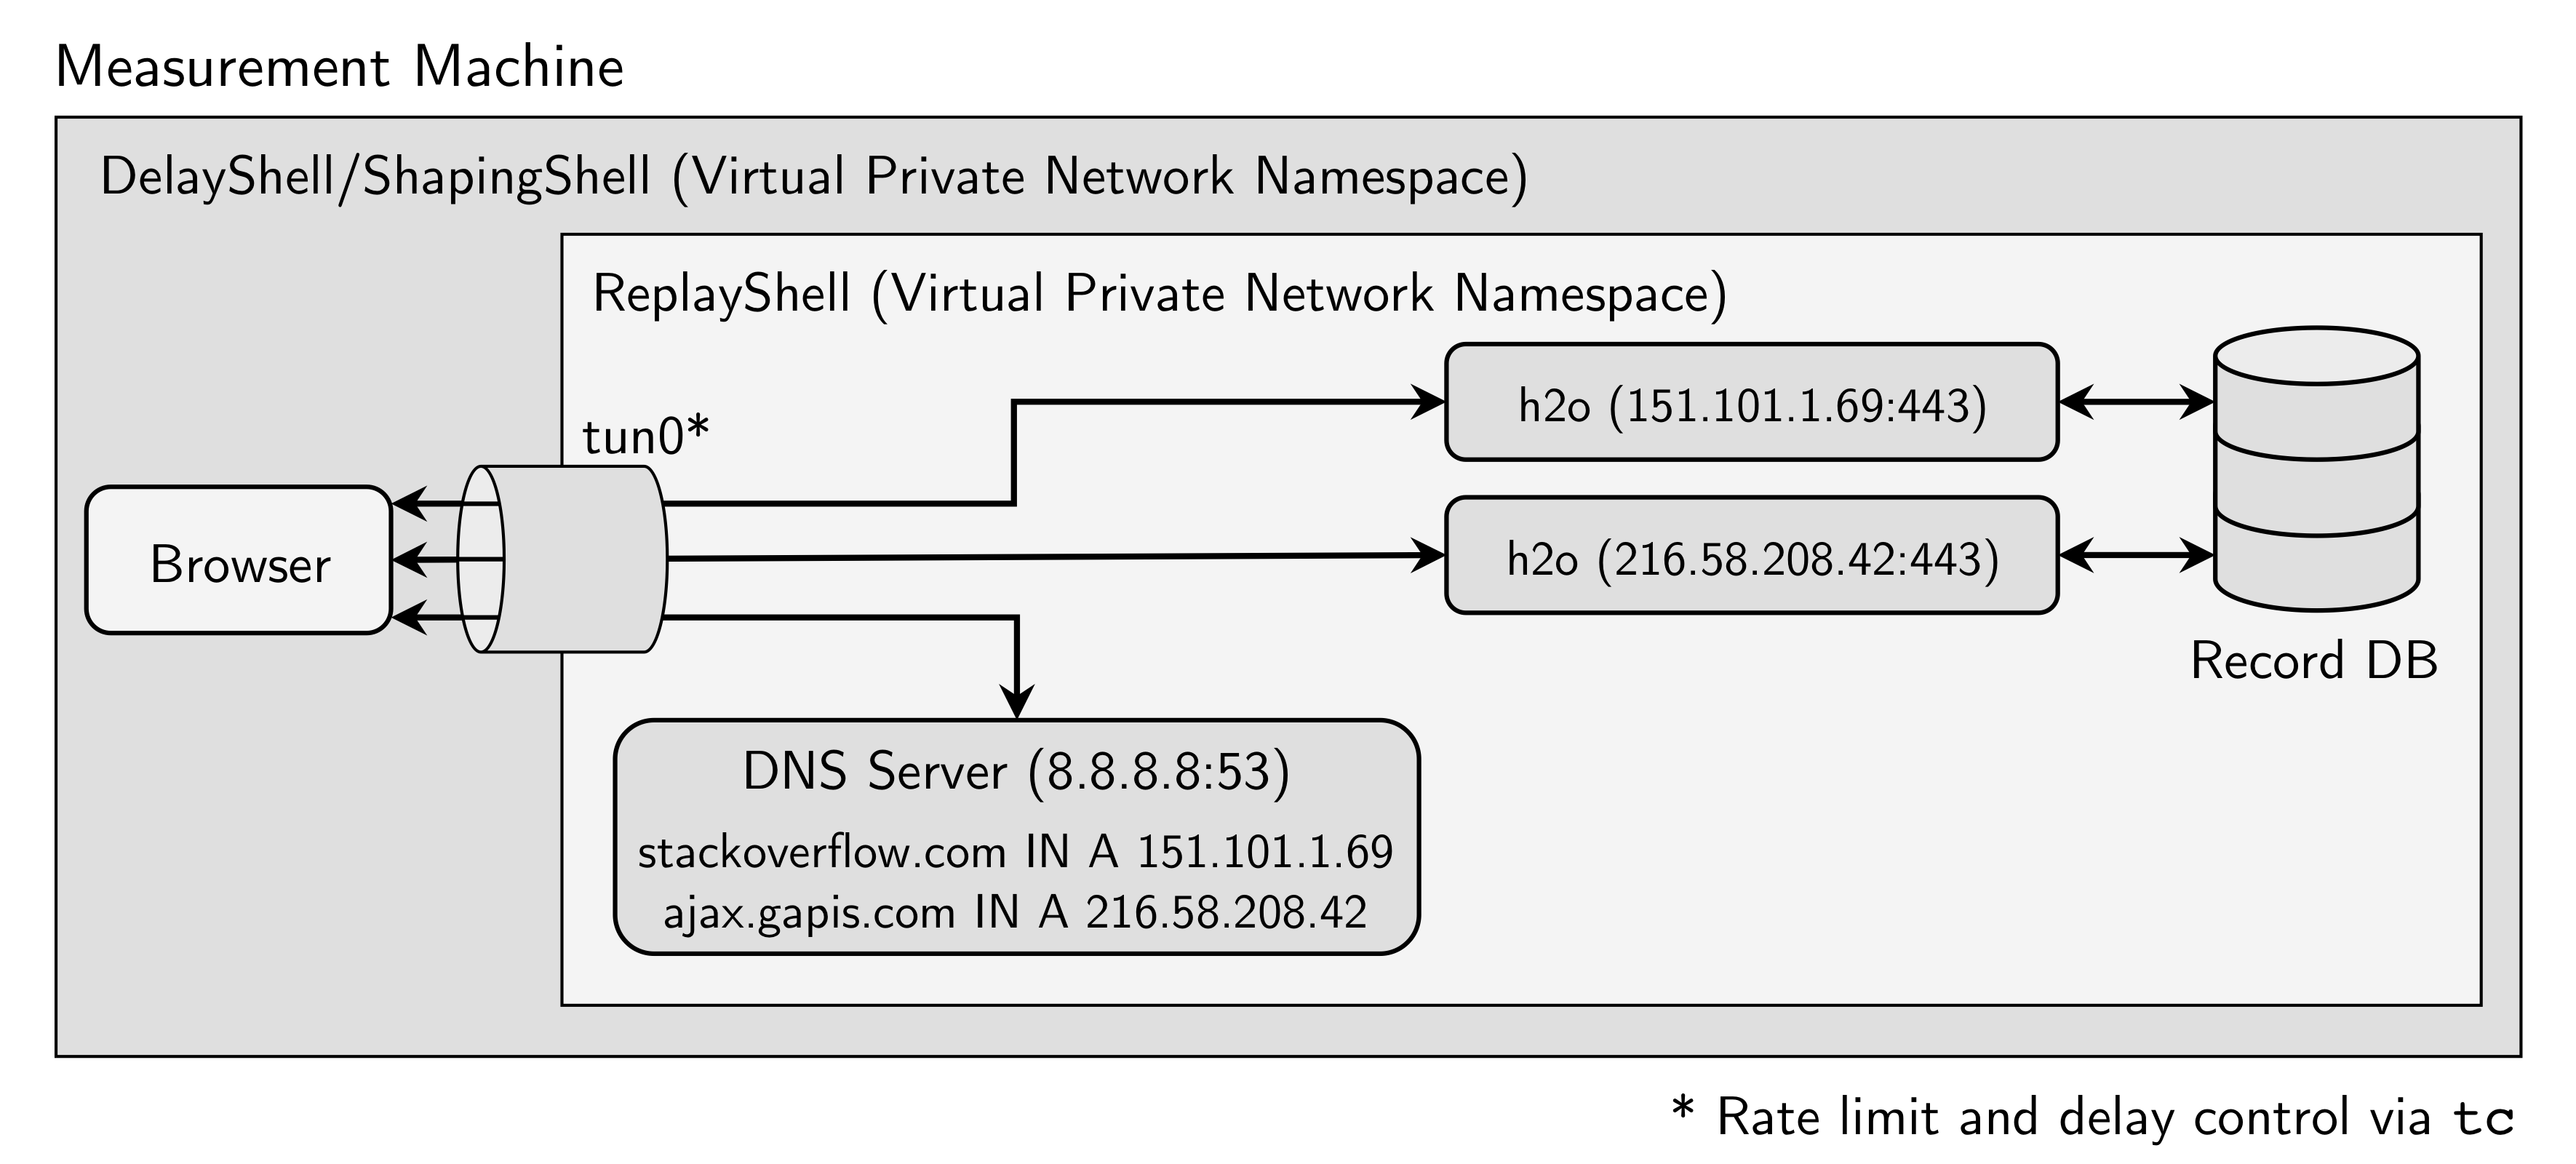
We base our testbed on Mahimahi, a framework that allows to record and replay HTTP traffic. Mahimahi uses namespaces to recreate the captured website's deployment, i.e., for each observed IP an own server is spawned, which offers to use the same connection pattern as in the real-world deployment. More information on the applied modifications to enable HTTP/2 support can be found in our repository and in our upcoming paper.
Testbed Evaluation
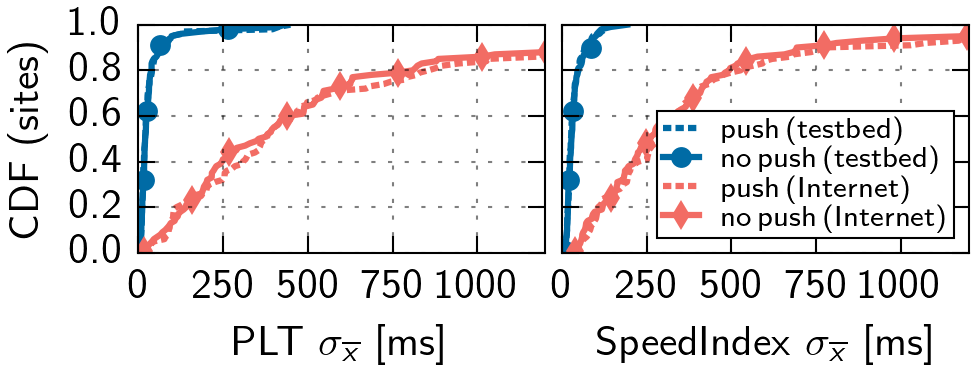
We evaluate our testbed by replaying 100 random websites using Server Push from the Alexa 1M list, with and without Server Push. Figure 2 shows the standard error for the Page Load Time (PLT) and SpeedIndex. For 95% of the websites, the error is < 100ms for PLT, which is similar for SpeedIndex. In the Internet, this holds only for 14% of the websites.
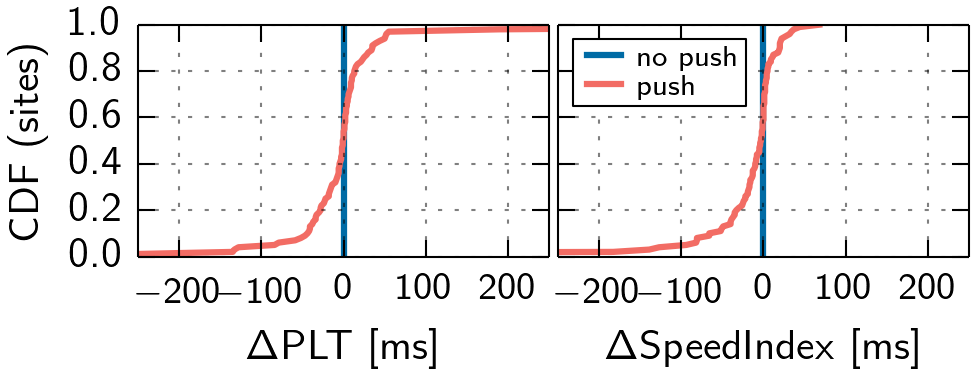
Although we remove a lot of variability, we still observe positive and negative performance impacts when Server Push is used (cf. Figure 3). In this setting, we let the websites in our replay testbed push the same resources as in the Internet.
Altering What to Push
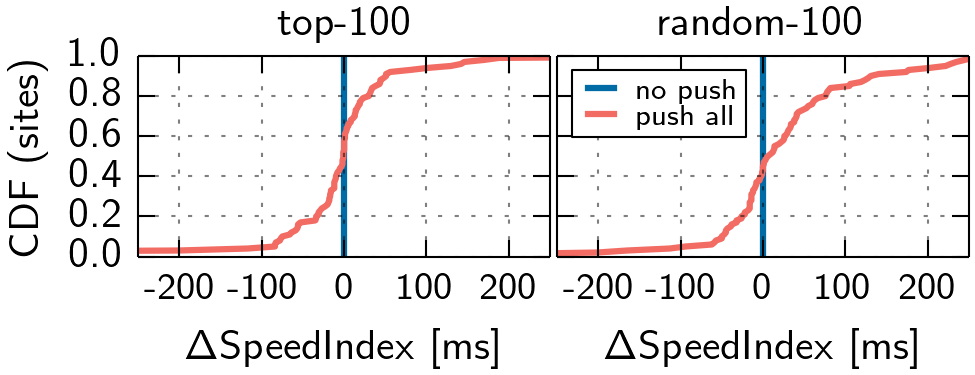
Given our testbed, we now replay real-world websites subject to various push strategies. As basis for our test, we select two disjunct random set of 100 websites each, one from the top 500 (top-100 set) of the Alexa 1M list and one from the top 1M (random-100). Please note that we do not capture if something is pushed, as we plan to apply different strategies.
Pushable Objects and Push Order
For the top-100 set, 52% of websites have < 20% of pushable resources, i.e., all other objects reside on servers not under the authority of the pushing server. In the random-100 set, this holds for 24%. Hence, many websites cannot push all objects. To obtain a resource order as a basis for our first strategy, we replay the websites for 31 times in our testbed without pushing any objects. We trace the requests and the defined stream priority of the browser used for the landing page and construct a dependency tree. By traversing the tree, we obtain a request order. Please note that across runs, this order does not stay stable. Thus, we use a majority vote to obtain a fixed order.
Varying Amount and Type of Objects
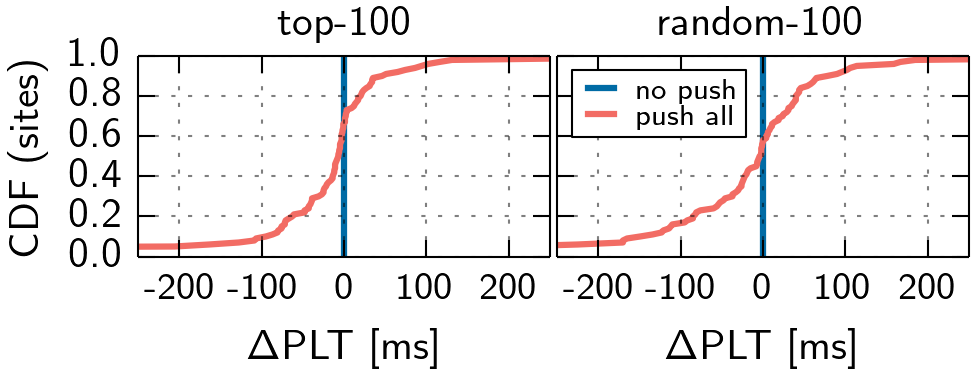
We start by pushing all pushable obejcts for each website in the previously computed order. These runs are repeated for 31 times and we present the median results in Figures 4 and 5. It can be observed, that not all websites can benefit from this strategy. Moreover, even if pushing all objects can improve certain metrics, it can waste bandwidth and cause contention at the server.
To reduce the amount of pushed objects, we first set the number to a fixed limit and in an alternative strategy, limit the pushed objects to a certain type, e.g., CSS or JavaScript. Please note that in this evaluation, we only consider the random-100 set, as not all websites in the top-100 set have enough objects.
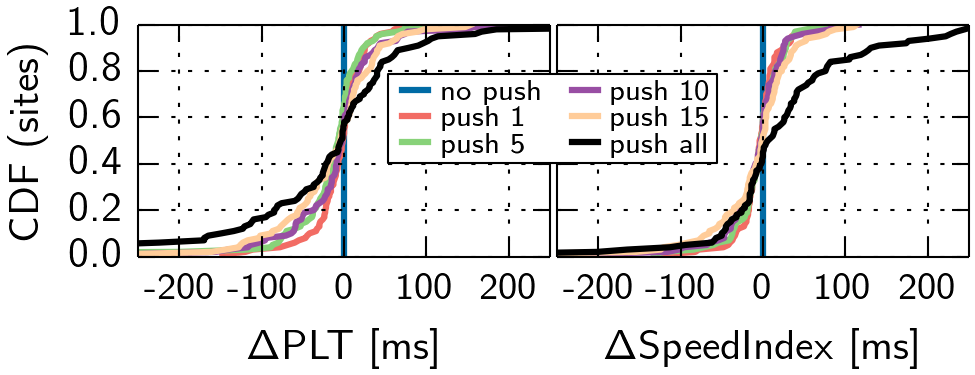
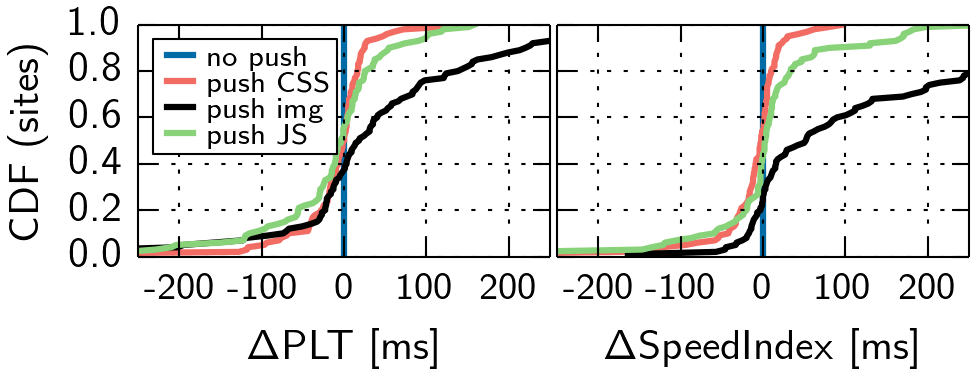
We observe that pushing less objects can lead to less detrimental effects compared to the push all case. Still, a lot of websites do not benefit. In addition, we observe that while pushing CSS and JavaScript can lead to improvements and impairments, pushing images leads to a worse SpeedIndex for 74% of the websites, compared to no push. This is no surprise, as images do not contribute to the generation of the DOM and the CSSOM, which are both essential parts of the layout and rendering process. Also, we tested type combinations (cf. Table 1), which lead to similar results.
| Strategy | Sites | PLT + |
PLT - |
SI + |
SI - |
|---|---|---|---|---|---|
| All | 100 | 58% | 42% | 45% | 55% |
| CSS | 82 | 50% | 50% | 54% | 46% |
| Images | 90 | 36% | 64% | 26% | 74% |
| JS | 84 | 58% | 42% | 42% | 58% |
| CSS+JS | 88 | 58% | 42% | 57% | 43% |
| CSS+Images | 92 | 45% | 55% | 32% | 68% |
Conclusion
Using push strategies that are generated as described above can improve website performance, but a lot for websites can also suffer. Pushing less can reduce negative effects, but not always imrprove the respective metrics. Overall, we do not find a one-fits-all strategy.
Synthetic Sites and Custom Strategies
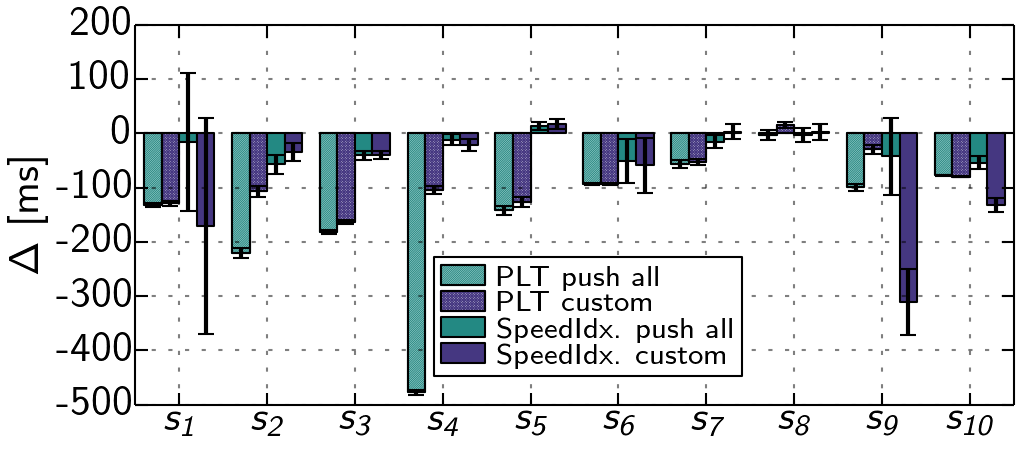
In the previous section, we considered real-world settings, e.g., content located at different servers, which can have unpredictable performance impacts. To furhter understand the performance influence factors of Server Push, we next create 10 synthetic websites (s1 – s10) that are snapshots of real websites or templates. We deploy them on a single server, i.e., we relocate all content. This time, instead of using generated strategies, we inspect the loading and rendering process in the browser and create custom strategies that favor objects that contribute to above-the-fold (viewable portion of website without scrolling) creation. We show the performance compared to the no push case in Figure 8 and discuss some of the results in the following case studies.
Case Studies
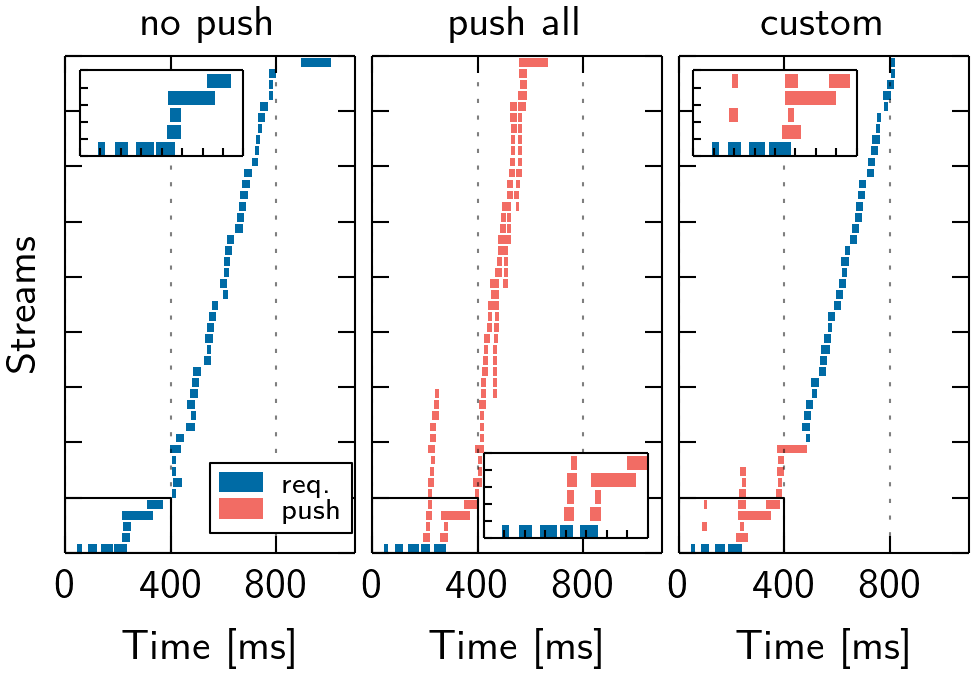
s1 shows a loading icon that fades and content is shown, once the DOM is ready. Thus, we push resources blocking the DOM construction (JS, CSS) and hidden fonts referenced in the CSS. On average, this improves SpeedIndex (but fluctuates), by only pushing 309 KB (1,057 KB, push all).
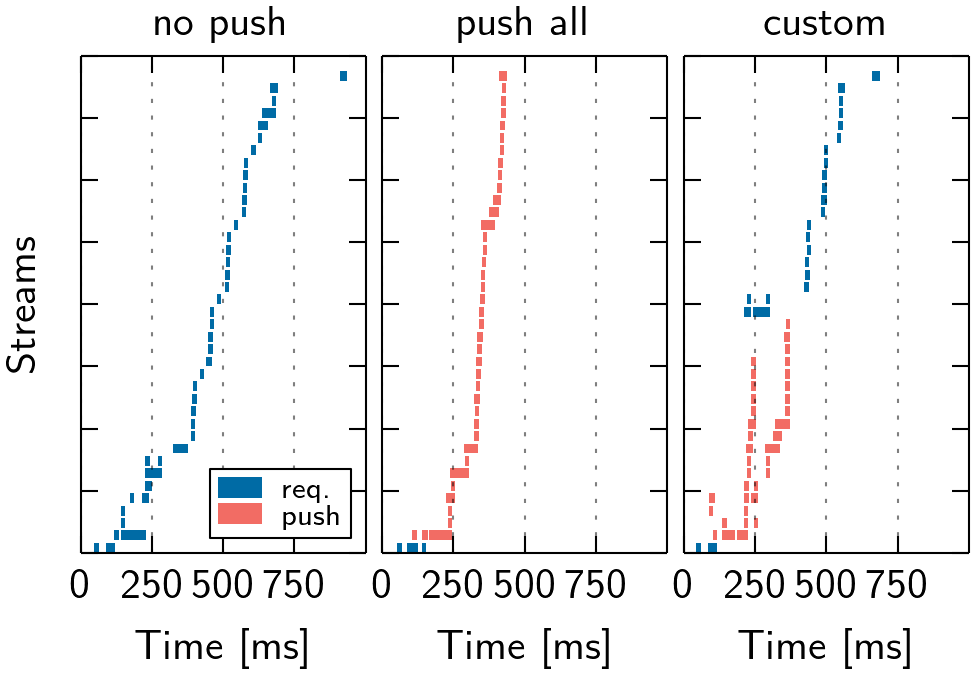
s5 takes 692 ms (push all) vs. 1,038 ms (no push) to be transferred (cf. Figure 9), but the metrics do not significantly improve. Regarding PLT, a blocking JS is referenced late in the <body>, which requires to create the CSSOM. This takes longer than the transfer, and the browser is not network but computation bound, affecting the overall process. Our strategy pushes four render- critical resources and some images. Yet, there is no benefit, as the browser can request resources as fast as pushing them, due to a large HTML, i.e., no network idle time.
We notice the same for s8. The HTML transfer requires multiple round trips to be completed. After the first chunk (cf. Figure 10), the browser can issue requests for six render-critical resources referenced early, and using push does not change the result.
Conclusion
Pushing all resources in this setting (hosted on single server) can reduce PLT compared to no push, but SpeedIndex rarely improves. Moreover, we do not observe significant detrimental effects. Yet, pushing everything can be wasteful in terms of bandwidth, e.g., if the resource is already cached, and cause contention between objects. For some websites, our custom strategy performs equally to push all by pushing fewer resources. However, even by manual inspection of the page load process, we are unable to optimize the SpeedIndex significantly for many websites. We thus conclude that the optimal push strategy is highly website-specific and requires manual effort, an in-depth understanding of the page load and render process, as well as the interplay of resources.
Interleaving
In our previous evaluations, we saw that the benefits of push can depend on the size of the base document and the position of resource references, e.g., pushing objects referenced late in large base documents can be beneficial while pushing early referenced objects may not. Additionally, we observed that the order of push objects can have a huge performance impact. Exemplary, pushing a lot of non-critical resources can delay more critical, with respect to above-the-fold, resources. Thus, our goal is to analyze if interleaving the base document with pushed objects can be beneficial. The intuition is to push the right resources at the right time.
Motivating Example
We create a website that references CSS in the <head> section and vary the size of the <body> by adding text. As baseline, the i) browser requests the CSS (no push). Next, we ii) push the CSS upon request for the HTML. Last, we iii) inter- leave the delivery of HTML such that after a fixed offset, the server makes a hard switch to push the CSS, before proceeding with the HTML (cf. Figure 11). Thereby, we incorporate page-specific knowledge into the strategy.
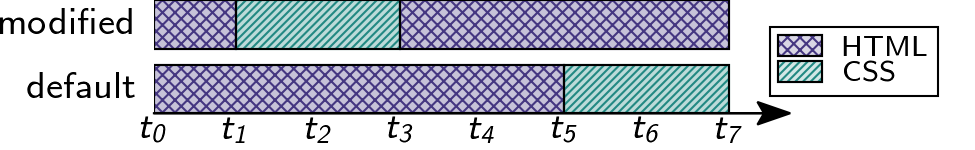
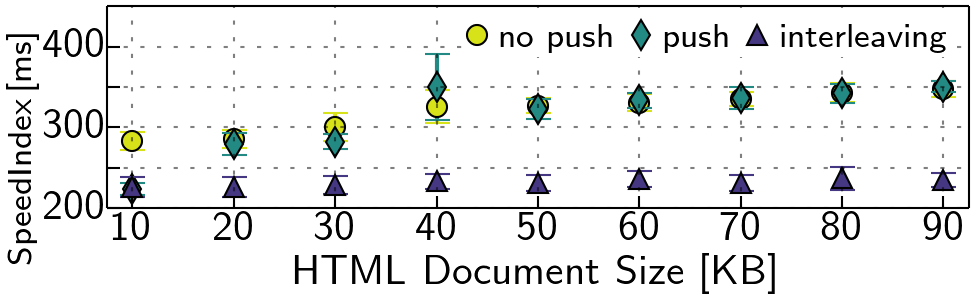
In the no push case, the browser assigns a lower priority to the CSS than for the HTML. The h20 server adheres to this setting and send the CSS after the HTML. In this setting, no push and push perform similar for an increasing HTML (cf. Figure 12), as the parent stream does not block. Interleaving the HTML with the CSS via push yields nearly constant and faster performance.
Real-World Websites
Motivated by the potential of interleaving push, we now focus on its applicability for real-world websites. In total, we select 20 websites (w1 – w20, cf. Table 2), covering a broad range of different content and websites structures. Exemplary, w5 consists of 8 requests served by one server, while w17 consists of 369 requests to 81 servers. In the following, we perform measurements with distinct modifications. In particular, we unify domains of the same infrastructure, e.g., img.bbystatic.com and bestbuy.com, and, based on inspection of the rendering process, host critical above-the-fold resources.
| ID | Domain | ID | Domain |
|---|---|---|---|
| w1 | wikipedia (*) | w11 | aliexpress |
| w2 | apple | w12 | ebay |
| w3 | yahoo | w13 | yelp |
| w4 | amazon | w14 | youtube |
| w5 | craigslist | w15 | microsoft | w6 | chase | w16 | twitter (+) |
| w7 | w17 | cnn | |
| w8 | bestbuy | w18 | wellsfargo |
| w9 | paypal | w19 | bankofamerica |
| w10 | walmart | w20 | nytimes |
Strategies
As the baseline, we i) use a no push strategy. We extend this to ii) a no push optimized strategy, where we use penthouse to compute a critical CSS from the included CSS, that is required to display above-the-fold content. We reference this critical CSS in the <head> section and all other CSS at the end of the <body>. In the iii) push all strategy, we push all resources hosted on the previously merged domains, which might include additional non-critical resources. We further extend this setting to the iv) push all optimized strategy. Here, we first push the critical CSS and critical above-the-fold resources in an interleaved fashion, and after the HTML, all other pushable resources. In the v) push critical strategy, we push only critical resources for above-the-fold content. Last, vi) the push critical optimized strategy adds the critical CSS modification to the prior strategy. For all optimized strategies, we use the modified server and the default in all other cases.
Evaluation and Case Studies
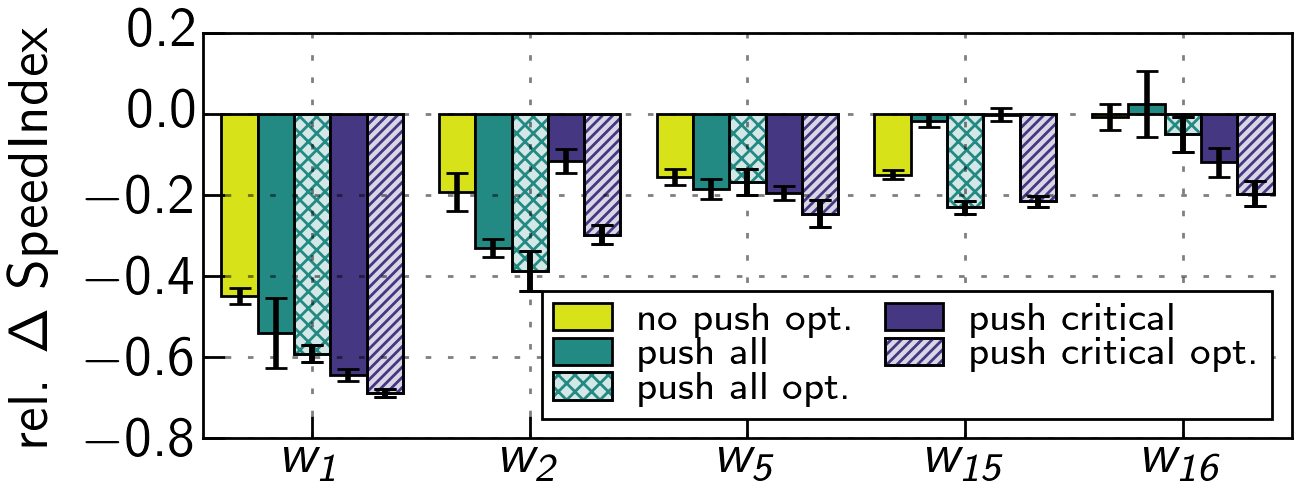
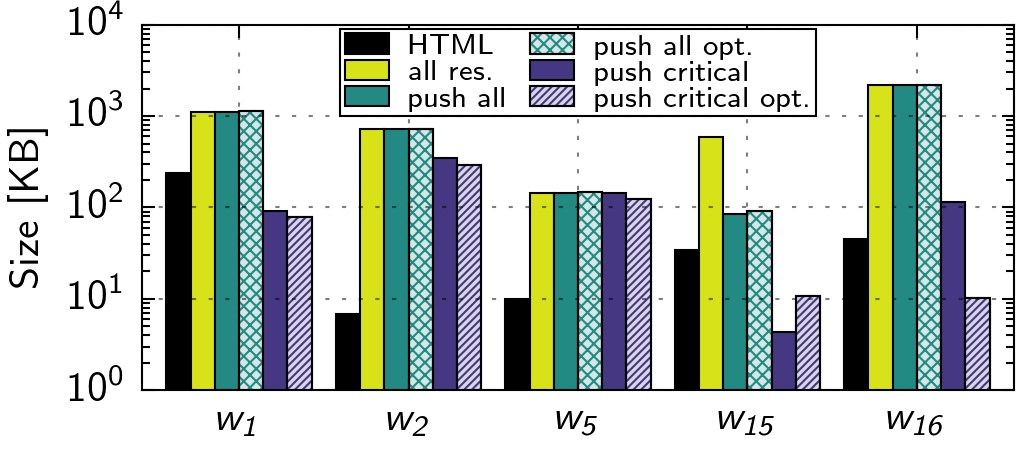
Using our push critical optimized strategy, we observe benefits for five websites (cf. Figure 13), but impairments or no advance (< 10 %) for all others. Next, we focus on a representative set (cf. Figure 14, discuss influence factors, and provide summary. Reported changes are averages and sizes are obtained on the protocol level (cf. Figure 15, Table 3).
| ID | HTML | Objects | push all | push all opt. |
push critical | push critical opt. |
|---|---|---|---|---|---|---|
| w1 | 236.25 | 1118.3 | 1117.55 | 1123.01 | 91.05 | 78.43 |
| w2 | 6.76 | 719.1 | 717.74 | 725.57 | 348.42 | 289.63 |
| w5 | 9.99 | 143.29 | 143.29 | 146.16 | 142.37 | 124.6 |
| w15 | 34.48 | 585.06 | 85.13 | 92.33 | 4.29 | 10.67 |
| w16 | 45.1 | 2206.96 | 2191.67 | 2201.87 | 114.95 | 10.2 |
The SpeedIndex of w1 is reduced by 44.95 % using only a critical CSS (no push optimized). With the push all optimized strategy, we see an improvement of 59.19 %, and even 68.85 % for push critical optimized. In the latter, we push 78.43 KB compared to 1,123 KB, saving 93 %. Here, interleaving push is beneficial, because of a large HTML size (236 KB compressed). In the no push case, the browser prioritizes the HTML over the CSS, and thus the server first sends the entire HTML. In our case, we push critical CSS after 4 KB of HTML, enabling to construct the DOM faster, and also push a blocking JS and two images, before continuing with the HTML. In the following video, you can see the performance of the push critical optimized strategy (right) to the no push case (left).
w2 already shows an improvement of 19.22 % when using a critical CSS in comparison to the no push strategy. In combination with the push all and push critical strategy, this yields the best performance, i.e., improvements of 33.05 % and 38.7 %. Our push critical optimized strategy achieves a competitive improvement of 29.74 %, only pushing 289.63 KB instead of 725.57 KB compared to the push all optimized strategy, saving ∼60 %. In the default case, several CSS requested after the HTML block the execution of JS and thus the DOM construction. With interleaving push, we extract the critical CSS and thus reduce the critical render path. The resulting effect (faster rendering) can be seen in the following video, comparing the push critical optimized strategy (right) to the no push case (left).
For w16, creating a critical CSS is not beneficial, as the website already uses such optimizations. Still, using our push critical optimized strategy improves performance by 19.67 %, pushing 10.2 KB of resources. w16 has a similar setting as w1, i.e., CSS is made dependent on the HTML (45 KB compressed). With interleaving push, the server starts pushing CSS after 12 KB of HTML, allowing to proceed with the construction of the DOM faster.
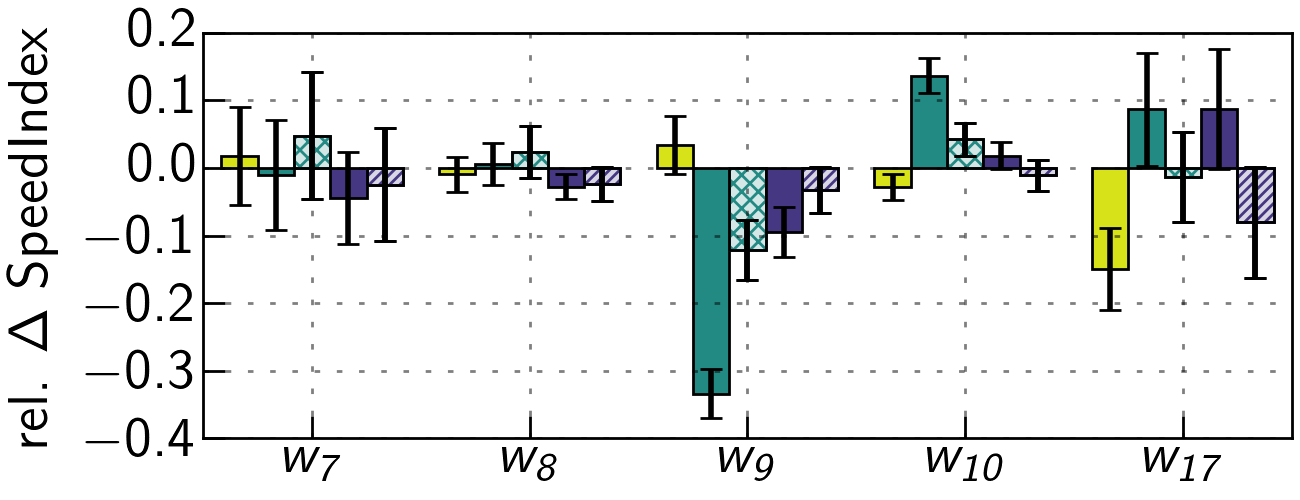
However, other websites exhibit no major improvements or even detrimental effects. Though we are able to remove 87 KB from the critical render path of website w7 by pushing the critical CSS instead of all CSS, the overall visual progress is not affected as much, because w7 contains a large blocking JS in the <head>. Similar effects are observed for w8.
w9 benefits from pushing all resources. Still, a critical CSS does not yield drastic improvements, as the HTML contains no blocking code until the end, i.e., no delay of processing.
For w10, we see detrimental effects by pushing all resources, as the page contains a lot of images, which causes bandwidth contention with other push streams. Pushing only critical resources reduces detrimental effects, but does not improve over no push. We find that a large portion of JS is inlined into the HTML. Therefore, interleaving push is not as efficient.
w17 benefits from a critical CSS in the no push optimized case, improving by 14.88 %, but using push does not yield improvements > 8 %. By manual inspection, we see that pushing improves the time of the first visual change, but not the SpeedIndex, which we attribute to the structural complexity and amount of requests. This effect can be seen in the following video, comparing the push critical optimized strategy (right) to the no push case (left).
Summary
By interleaving the HTML with critical CSS and critical above-the-fold resources on the H2 frame level, we can improve some websites in our testbed. Still, the benefits highly depend on the underlying website’s structure and have to be evaluated individually. This requires a deep understanding of the page load and rendering process in the browser. Most promising examples include websites where we find critical blocking resources, i.e., CSS or JS affecting the DOM construction, referenced early. We also observe that switching to pushing critical resources while the browser processes inlined JS can also be beneficial.
Still, many websites do not benefit from our optimizations in our testbed, based on various reasons. Some websites already utilize optimizations such as inlining critical JS or CSS, such that a browser is not blocked after receiving the first bytes of HTML, limiting the effect of interleaving push. Also, we see that if a website contains a lot of third-party resources, e.g., w17, the effects of interleaving push delude due to the complexity of the entire page load process.
Discussion
In this work, we investigated if the current Web is ready for Server Push. We studied the effects of several strategies in our controlled testbed and find that simple, automatically generated strategies can optimize as well as decrease performance. This highlights the fundamental challenge of optimal Server Push usage.
By tailoring strategies in combination with a novel server resource scheduler we show that the performance of some popular websites can indeed be improved.
However, not every website benefits from our modifications.
We find that, while the Web may be technically ready to support Server Push, it is no feature that can be utilized easily. If and how Server Push should be used is subject to a number of website-specificaspects. Non-site specific adoption can very easily lower the webperformance. Thus, no general guidelines can be provided for optimal push usage, making the feature not straightforward to apply.The question here is not if the Web is ready for Server Push but if the web engineers are eager to manual tuning.
The source code, documentation and some results can be obtained from this repository.
Again, we refer the interested reader to our upcoming paper at ACM CoNEXT 2018.
A pre-print of the paper is available here.